Weekly Global Report, Food and Beverage, Primary Products, Services:
On this page
Summary
- New Zealand’s two-way trade grew solidly in 2022 as global and domestic demand showed surprising resilience in the face of slowing global growth, rising inflation, and tightening credit conditions. The value of trade was also underpinned by an increase in global inflation to 8.8%, which supported the incomes of exporters but also added to the cost of imports.
- New Zealand’s two-way trade value now sits at $197.0 billion, growing by 21% year on year. Total exports (goods and services) grew by 16% to $89.9 billion, while total imports grew by 25% to $107.1 billion.
- Goods exports grew 13% to $72.0 billion for the year ending December 2022, while goods imports grew 21% to $80.1 billion.
- Driven by the removal of COVID-19 restrictions, services exports are continuing their recovery, rising 28% to $17.9 billion and services imports rising 38% to $26.9 billion.
- This recovery is in the face of significant international headwinds. In particular, Russia’s war on Ukraine exacerbated inflationary pressures and weighed heavily on growth prospects for a global economy that was still recovering from the effects of COVID-19. This will further delay the likelihood of a return to pre-pandemic global economic growth.
- However, with China’s easing of its zero-COVID policy, supply chain pressures cooling, and oil prices falling, we can expect some of these international pressures to ease in the coming year and for the weakness in global economic growth to bottom out.
- Nevertheless, Cyclone Gabrielle has delivered a shock to our key exporting regions. The economic effects, although yet are to be quantified, will be significant for some export sectors, especially apples.
Report
The closing of 2022 saw the New Zealand economy running hot, with household spending remaining strong and businesses continuing to hire staff, which has contributed to low unemployment and rising wages.
This has been reflected in the 21% rise in the value of New Zealand’s two-way trade during 2022, increasing to $197.0 billion compared with the previous year. Total exports rose 16% to $89.9 billion, while imports rose 25% to $107.1 billion. (See Figure 1)
Figure 1: New Zealand’s total trade performance (2019 – 2022)
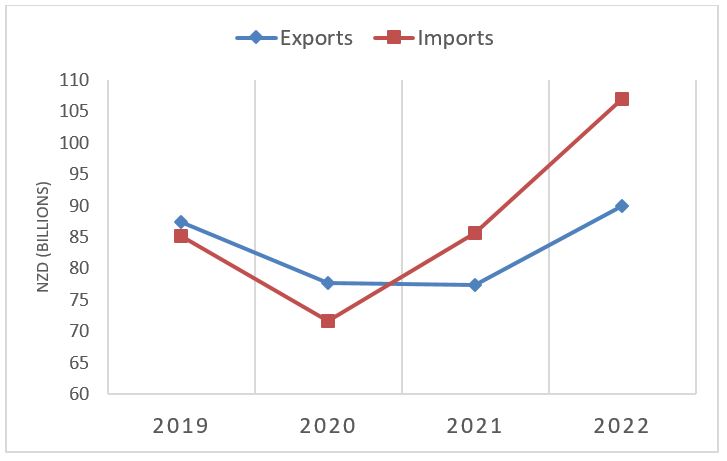
Two-way trade remained strong in 2022
In the year ended December 2022 New Zealand’s total goods exports grew by 13% to $72 billion, and now sits 20% above pre-pandemic levels.
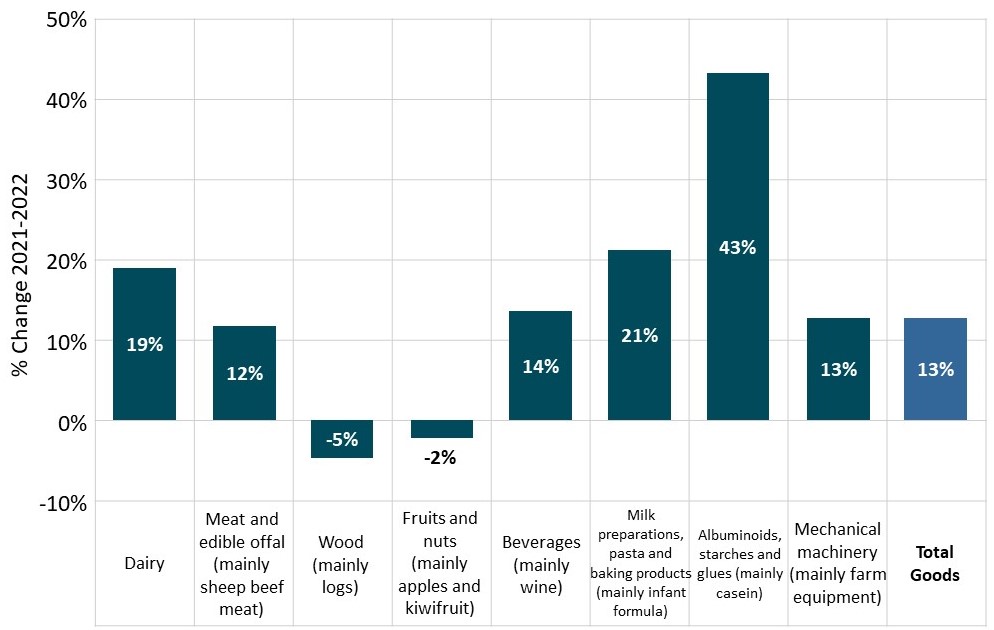
Despite the challenges faced by the farming sector in 2022 (i.e. labour shortages, supply chain disruptions, global inflationary pressures), New Zealand’s food exports have continued to perform impressively. Dairy products remained one of our best performing export sectors, boosted by strong prices and favourable exchange rates. Exports of milk powder, butter, and cheese rose 20%, along with casein products up 44%. Wine exports rose 14% thanks to a strong harvest and improved prices. Meat exports rose 12%, benefitting from increased demand for beef imports from China over the first three quarters of the year. Seafood exports rose by 8%, while crude oil exports doubled in value in 2022 to $913 million as the war in Ukraine led to significant price spikes in May. Aluminium exports continue to rise, owing to increasing worldwide aluminium prices, up 15% and now at $1.65 billion. (see Figure 2)
Fruit and wood exports, on the other hand, have seen declines of 2% and 5% respectively. The horticulture sector saw mixed results over 2022, with lower production, higher shipping costs, and labour availability affecting the sector’s export revenue. Kiwifruit exports suffered the most due to a tough growing season, falling 5% to $2.6 billion. Avocado also struggled, falling to $81.6 million (down 27%) as price weaknesses affected returns, influenced by increased volumes in the global market from Australia. Conversely, apple exports rose 6% to $901.5 million in the same period. Forestry exports, in particular logs, suffered largely in part due to China’s softening construction activity. Medical equipment exports fell 17% from $1.4 billion to $1.2 billion as COVID-19 demand reduced alongside persistent supply logistics constraints. (See Figure 2)
Figure 2: Change in Goods Exports (Year ended December 2022)
The growth in goods exports was supported by increased trade with a range of partners (particularly Australia, the US, Japan, Korea and Indonesia). Due to lockdown measures, export growth to China slowed significantly over the year, from 16% in 2021 to just 1% in 2022. Despite not contributing substantially to the overall growth of New Zealand’s export revenues, at $20.1 billion China continues to be our largest export destination, still representing 28% of our goods exports in 2022.
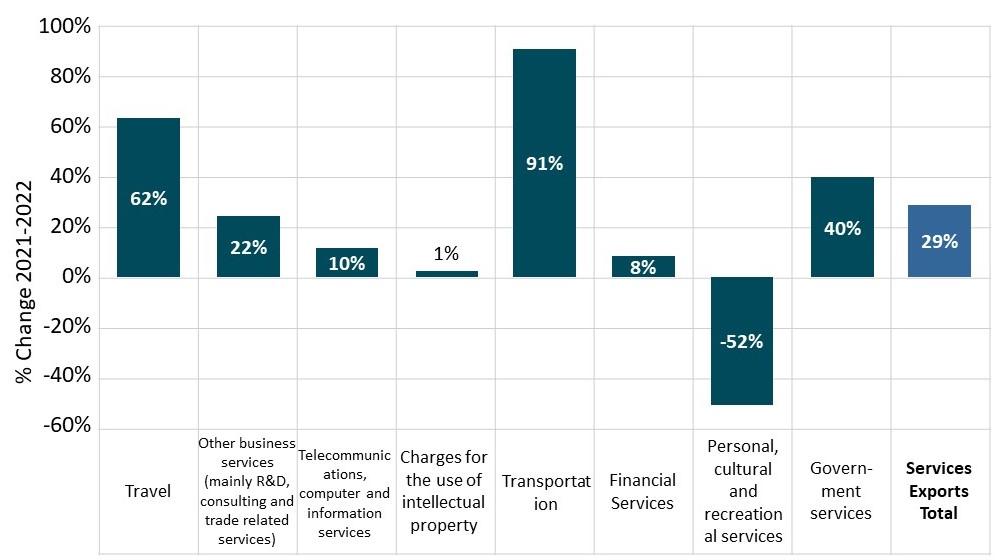
Services exports are continuing to recover, rising 29% to $14.2 billion in 2022. Despite this strong increase, services exports have not yet reached 2019 values and remain 37% below pre-COVID levels). Travel increased 62% to $6.6 billion and transport grew 91% to $2.5 billion, but both remained below pre-COVID levels. Business services (such as R&D, consultancy, and trade-related services) have steadily increased since COVID-19, rising 22% to $2.6 billion. Personal, cultural, and recreational services exports (mainly driven by the screen industry) halved to $0.49 billion, following the completion of a series of high profile film productions (i.e. The Power of the Dog, Whina, The Beatles: Get Back, and the Avatar sequels). (See Figure 3)
Figure 3: Change in Services Exports (Year ended December 2022)
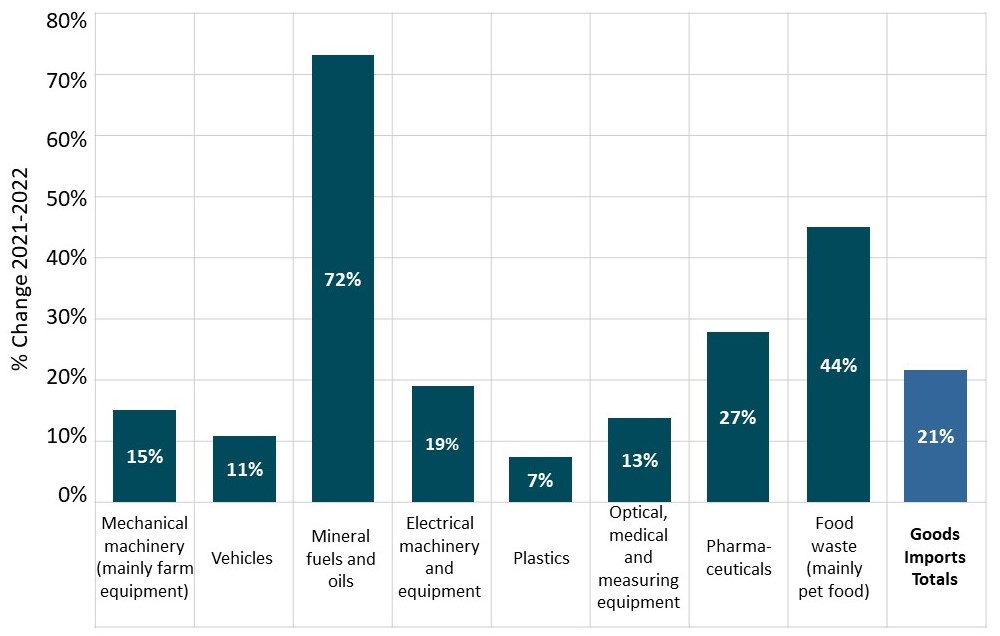
Strong consumer demand and construction activity, combined with higher prices for imported goods, have also contributed to a notable increase in goods imports, which rose 23% to $86.7 billion in 2022.
Increases in the value of our imports have been driven mainly by rises in oil prices, costlier supply chains, as well as other input costs. Petroleum imports grew by 76% to $9.9 billion, as the war in Ukraine saw prices peak at roughly US$120 per barrel in June (up 61% from the previous year). Other farm imports, such as fertiliser, vehicles, machinery, and cereals, have also experienced strong increases, driven by strong global inflationary pressures (fertilizer were imports up 36%, vehicles up 11%, mechanical machinery up 15%, and cereals up 48%). (See Figure 4)
Figure 4: Change in Goods Imports (Year ended December 2022)
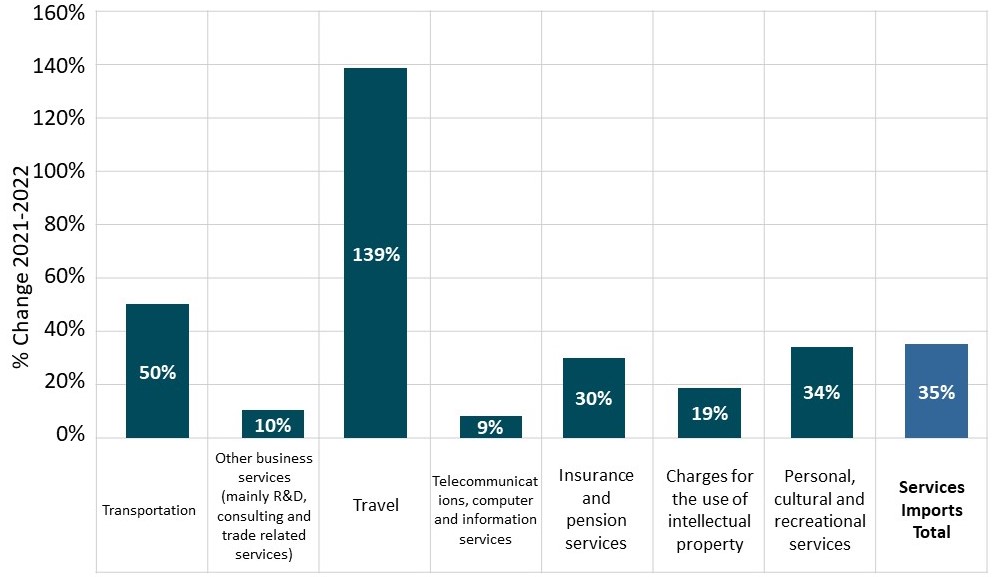
Services imports are higher than pre-COVID levels (rising 16% when comparing 2022 and 2019 December year-end). As we have reconnected with the world, services imports related to reconnecting with the world, such as passenger transport, have skyrocketed by 138.6% to $1.4 billion, and continue to grow albeit from a very low base. Travel, however, remains below 2019 values (at 37% below pre-COVID levels). (See Figure 5)
Figure 5: Change in Services Imports (Year ended December 2022)
Due to high import prices, our trade balance deficit in 2022 reached its highest point in decades at $17 billion, more than double 2021’s deficit. While pressures on this deficit remain, the return of tourism and international education, combined with weakening energy costs, should help to partially offset this in the coming year.
Looking ahead
Although New Zealand's trade performed well last year, international headwinds are expected to remain in the year ahead. COVID-19’s negative effects on global trade, including inflation and supply chain disruption, have been severely exacerbated by Russia’s war in Ukraine. This will continue to act as a drag on global economic growth in 2023, with projected growth for New Zealand’s major trading partners expected to be a modest 2.6% in 2023 (well below the historical average of 3.3%).
There are still pockets of optimism for some export sectors. Chinese demand for New Zealand travel (i.e. tourism and international education) and goods is expected to pick up over the course of 2023 as the Chinese economy improves. However, with pressures on Beijing to curb inflation, commentators expect China’s economic growth to remain (deliberately) modest over the next couple of years, which will have flow on impacts for New Zealand's export opportunities.
Despite its challenges, there appear to be signs that the weakness in global economic growth is bottoming out, with global inflationary pressures easing and labour markets remaining resilient. In January, the IMF upgraded its global growth projections to 2.9% for 2023 (up 0.2% from previous forecasts) and 3.1% in 2024. Despite this improvement, these growth rates remain significantly below previous years, including 5.9% in 2021 and 3.4% in 2022.
More reports
View full list of market reports
If you would like to request a topic for reporting please email exports@mfat.net
Sign up for email alerts
To get email alerts when new reports are published, go to our subscription page(external link)
Learn more about exporting to this market
New Zealand Trade & Enterprise’s comprehensive market guides(external link) cover export regulations, business culture, market-entry strategies and more.
Disclaimer
This information released in this report aligns with the provisions of the Official Information Act 1982. The opinions and analysis expressed in this report are the author’s own and do not necessarily reflect the views or official policy position of the New Zealand Government. The Ministry of Foreign Affairs and Trade and the New Zealand Government take no responsibility for the accuracy of this report.