Food and Beverage, Primary Products, Services:
On this page
Summary
- Recently released trade data shows a positive performance for the export sector, with exports rising by 7.4% to reach $105 billion in the year to March 2025. This export success is helping to fuel economic growth and has narrowed the trade deficit.
- Goods exports grew 7.1% to $74 billion, with favourable domestic production conditions and rising global commodity prices driving kiwifruit, dairy, and meat revenue growth.
- Services exports grew a strong 8.1% to $31 billion. Travel export revenue has now reached pre-COVID levels ($16 billion), although tourist arrival numbers still sit at around 80%.
The EU and UK markets surged by 22.6% and 21.2% respectively, likely reflecting enhanced opportunities from recent FTAs. - Exports to the US grew 6.4% to $16.8 billion with significant growth over the last six months potentially due in part to importers front loading New Zealand product to avoid looming tariffs.
- The direct and indirect impacts from US tariff announcements will show up in future trade data releases with global economic growth predicted to weaken. This may reduce demand for New Zealand exports by the end of 2025.
- Despite the uncertainty, supported by the export sector, the New Zealand economy is now recovering, following a period of contraction. GDP grew 0.8% over the March quarter and Treasury is predicting it to grow by 3% per annum over the next three years.
Report
Exports experienced a strong start to 2025 helping to lift economic growth
StatsNZ trade data released for the first quarter shows a positive start to the year. Exports for the three months to March were 14.6% higher than the same period in the previous year. Over the last year a combination of favourable domestic primary production conditions and rising global commodity prices have supported a 7.4% increase in the value of exports, which reached $105 billion in the year to March 2025. Merchandise exports rose 7.1% to reach $74 billion and services exports posted another strong gain, growing 8.1% to $31 billion. This has helped support a rebound in New Zealand's economy, with GDP rising 0.8% in the March quarter after a difficult 2024.
The top marks go to kiwifruit, dairy, meat, and tourism exports
Horticulture exports rose 33.2% to $6.1 billion in the year to March 2025. Apple exports rose 20% to pass $1 billion in revenue. The growth came mostly from an 83% increase in exports into the Chinese market, which now makes up around a third of New Zealand’s total apple exports. However, kiwifruit was the standout performer, increasing 45.9% and now contributes to more than half ($3.7 billion) of the revenue generated by horticulture exports. This gain reflects a combination of favourable growing conditions (kiwifruit had a record crop in 2024) and increased international demand (consistent across our top export destinations). Supporting future kiwifruit export growth, Zespri are increasing new licenses for the production gold kiwifruit this year. The June 2025 Situation and Outlook for Primary Industries (SOPI(external link)) report predicts this success in horticulture will continue over the next year, with continued growth in wine, apples, and another record-breaking season for kiwifruit expected.
Dairy exports rose 7.1% to $26.2 billion in the year to March 2025. Both categories of butter, fat and cream, and infant formula performed exceptionally, recording 23.2% and 25.5% increases, respectively. Export growth was positive across all dairy categories driven by increasing global dairy commodity prices – reflecting both stronger international demand and tight global supply – a weaker NZ dollar, and strong domestic production.
Meat exports rose 5.4% to $11.7 billion in the year to March 2025. Underlying the headline figure, beef rose 6.9% to $4.7 billion and sheep meat rose 7.3% to $3.9 billion. The drivers of meat export growth were similar to dairy, with a higher global commodity price (caused by robust demand and constrained supply), coupled with favourable domestic production conditions (good weather) supporting export returns. In particular, declining US production continues to impact global beef meat supply. The US is facing significant challenges with declining herd sizes, continued drought in the Midwest, and feed shortages. With the demand for beef meat remaining resilient, New Zealand exporters are helping filling part of the gap left by US production (driving a 29.8% increase in exports to the US).
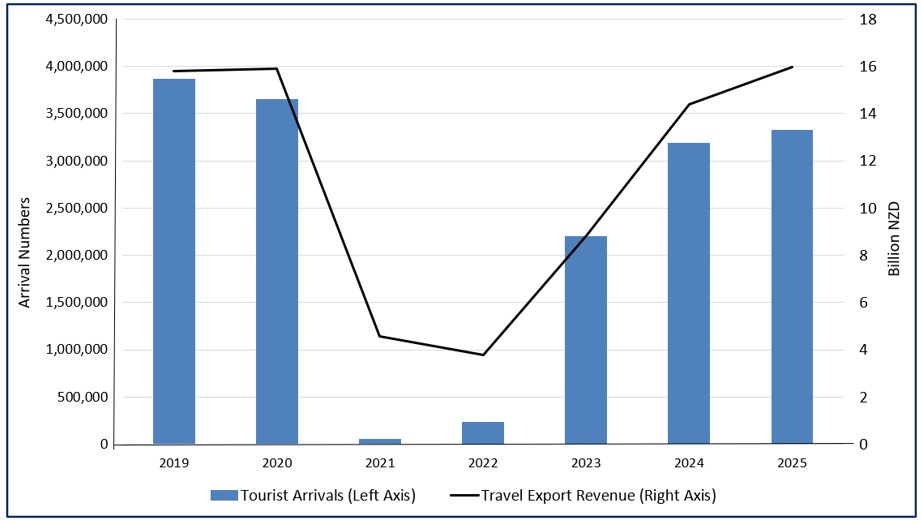
Export revenue from tourism has reached pre-COVID levels, though tourist numbers have not
Travel exports were the largest contributor to the rise in services exports, increasing 11.0% to $16 billion in the year to March 2025. Increased spending per visitor pushed travel export revenue above pre-COVID levels for the first time, with overseas travel arrivals rising by 137,000 to 3.3 million in the year to March 2025. However, the number of travellers in March 2025 (311,800) was still 18% below pre-COVID numbers (Figure 1).
Figure 1: Tourist visitor arrivals and travel export revenue (Year ended March 2019-2025)
However, not all export sectors experienced strong performance
The Forestry sector experienced strong increases in sawn timber, paper, and pulp exports, which supported an overall export increase of 2.8% to $6 billion in the year to March 2025. However, New Zealand's largest forestry export category, logs, which make up over 50% ($3.1 billion) of the total revenue fell 8.2%. Weakness in our largest market for logs, China, continues to weigh on log exports. However, as Chinese government interventions attempt to rectify issues in the property market, there is hope demand may stabilise overtime. The recovery of processed wood exports (e.g. sawn timber) could be a sign of easing of the supply issues after Cyclone Gabrielle impacted several processing plants.
Seafood exports grew 2.1% to $2.2 billion in the year to March 2025, driven by growth in Mussels (up 7.6%), Hoki (up 8.6%) and Salmon (up 30.1%). However, Rock lobster exports plummeted 18.8% to $327 million as increased competitive pressure from Australian supply into China lowered export returns. New Zealand rock lobster exports rose in 2020 after China banned rock lobster imports from Australia. However, with lifting of this ban in December 2024, New Zealand is now competing again with Australian product. In the medium to long run, the seafood sector is predicted to grow steadily, supported by high export prices, sustained demand, and the potential for growth in aquaculture production (compared to wild caught species which have restricted harvest limits).
Supported by FTAs, exports to the EU and UK surged, demonstrating the benefits of our trade architecture diversification
Exports to the EU and UK rose more than any other trading partner reflecting the enhanced opportunities for exporters from recent FTA’s. Exports to the European Union, were 22.6% ($7.2 billion) higher on a year earlier. Germany (30%), the Netherlands (24%) and Italy (23%) contributed the most to growth. Kiwifruit exports stood out, increasing 70.8% to $956 million, likely reflecting the removal of tariffs, and record New Zealand production. Export success in the EU was closely followed by the UK, which experienced a 21.2% ($3.8 billion) rise over the same period. Dairy exporters made the most of falling tariff rates from the UK-FTA, with a huge 140.6% growth to reach $178 million in revenue. Two years on from the UK-FTA (one year for the EU-FTA) entering into force, this data indicates that businesses are already benefiting from improved market access. It also shows the benefits our trade architecture is providing in helping to diversify our export markets, particularly given how elevated global trade policy uncertainty is currently.
Exports to China posted modest gains as growing dairy and kiwifruit exports were partly offset by weaker forestry and seafood exports
Exports to China grew a modest 3.0% to reach $21 billion in the year to March 2025. While Chinese tourist arrival numbers have not yet reached pre-COVID levels, travel exports grew 18.4% to reach $2.6 billion, making up 87% of services exports to China. For goods exports, results were varied, dairy grew 13.9% and horticulture 41.9%. However, forestry (given the ongoing construction sector weakness) fell 7.9% and seafood (driven by greater supply into the market) fell 7.5%.
Exports to the US grew, potentially representing evidence of stockpiling ahead of tariff hikes
The US has continued to be one of New Zealand’s fastest growing export markets with total exports growing 6.4% to $16.8 billion over the past year. Ending in March 2025, this data encompasses the period just prior to the US’s reciprocal tariffs (announced 2 April). Exports in the March quarter were 17.2% higher than the previous year, potentially reflecting importers in the US front loading New Zealand product to avoid paying looming tariffs. The direct impacts of US tariffs on New Zealand’s export performance are expected to become evident in the next quarterly trade data release in September.
Good news! The economy is growing
The New Zealand economy posted stronger-than-expected growth in the first quarter. GDP rose by 0.8%, slightly ahead of consensus forecasts. Economic activity expected to continue its recovery, with Treasury forecasting GDP growth of around 3% over the next three years (Figure 3). Drivers for this positive upturn include a mixture of 1) relief from falling interest rates, with the full effects still to filter through the economy, and 2) a strong export performance driven by improving export returns from the primary sector and travel.
Figure 2: New Zealand real GDP growth
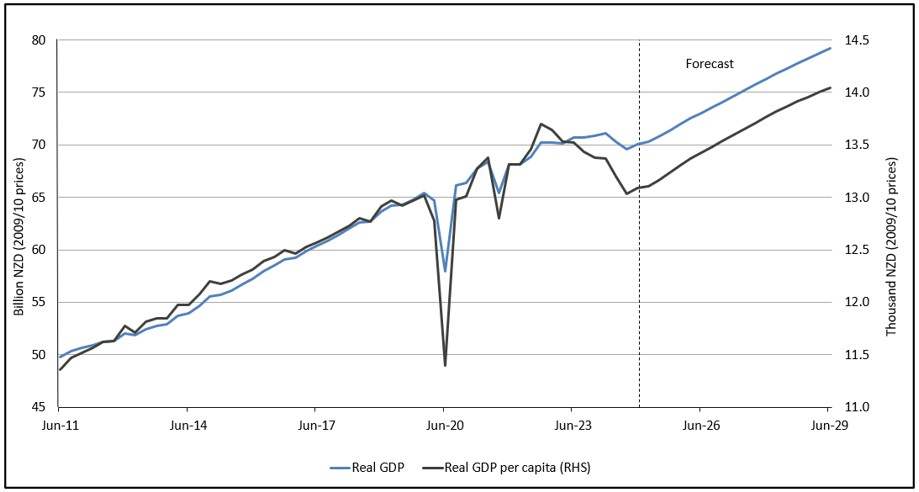
Source: BEFU(external link), Treasury 2025
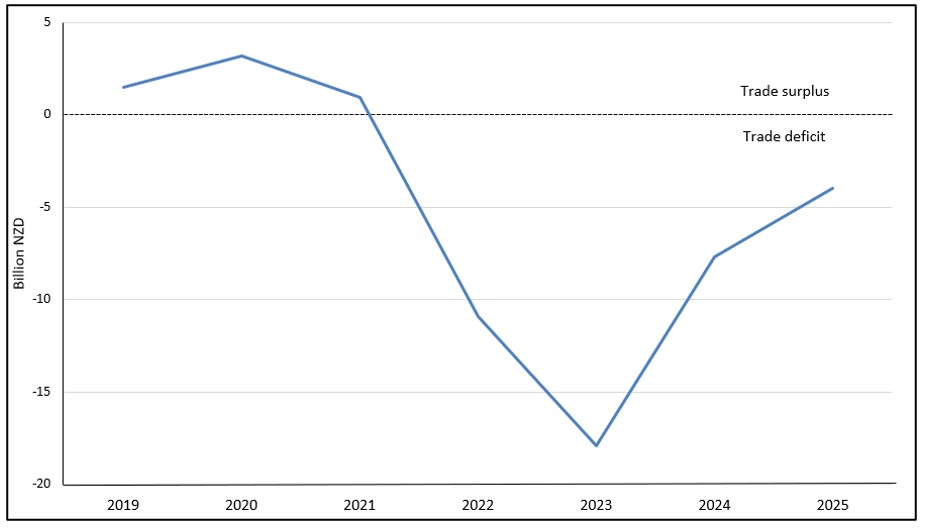
Import growth was more muted…helping the trade deficit to narrow further
Following a decline in 2024, imports grew by 3.4% to reach $109 billion in the year to March 2025, a positive sign that consumers and businesses are feeling less squeezed than this time last year. Services imports grew 7.3% driven by rising appetite for travel, while goods growth was just 1.8% reflecting lower oil prices and fewer vehicle imports.
With export growth outstripping import growth, New Zealand’s trade deficit has continued to narrow. It was $4 billion in the year to March 2025, following $7.7 billion, and $17.9 billion in 2024 and 2023 March years, respectively. This represents the smallest deficit since 2021 when New Zealand last recorded a trade surplus (Figure 4).
Figure 3: New Zealand trade balance (Year ended March 2019 – 2025)
Comment
While these trade statistics highlight the benefit to New Zealand exporters of lowering trade barriers, we are now facing an environment of rising global trade protectionism. Recent US tariff announcements have caught volatility in global financial markets. This ongoing uncertainty represents a major risk to global growth and the New Zealand economy. The IMF is now forecasting global economic growth to be just 2% over the next two years and 2.3% thereafter, well below the 3.3% average of the past two decades. Despite commodity prices for key exports being at a high point in their cycle, this global growth decline is expected to weigh on demand for New Zealand exports over the course of the coming year. In the face of these global headwinds, MPI still expects that primary sector exports to remain resilient over the coming year.
For the domestic economy, the impact of a slowing global trade environment is expected to be partially offset in the short term by the positive domestic economic conditions, driven in part by falling interest rates. While only time will tell the impact this will have on the domestic economy, two strong quarters of GDP growth supported by ongoing export sector resilience, should mean that New Zealand is better placed to weather any incoming storm than this time last year.
More reports
View full list of market reports
If you would like to request a topic for reporting please email exports@mfat.net
Sign up for email alerts
To get email alerts when new reports are published, go to our subscription page(external link)
Learn more about exporting to this market
New Zealand Trade & Enterprise’s comprehensive market guides(external link) export regulations, business culture, market-entry strategies and more.
Disclaimer
This information released in this report aligns with the provisions of the Official Information Act 1982. The opinions and analysis expressed in this report are the author’s own and do not necessarily reflect the views or official policy position of the New Zealand Government. The Ministry of Foreign Affairs and Trade and the New Zealand Government take no responsibility for the accuracy of this report.
Copyright
Crown copyright ©. Website copyright statement is licensed under the Creative Commons Attribution 4.0 International licence(external link). In essence, you are free to copy, distribute and adapt the work, as long as you attribute the work to the Crown and abide by the other licence terms.