

Food and Beverage, Primary Products, Services, Government:
On this page
Summary
Japan’s Cabinet Office projects real GDP growth of 0.9% for the 2026 financial year (April 2026 to March 2027). Preliminary data for July 2026 indicates that Japan’s current cycle of economic growth may have become its longest period of economic expansion since the end of World War II, the current period beginning in May 2020 following COVID-19 pandemic lows.
Government projections for real GDP growth for the current financial year have been revised downward, with private consumption and corporate investment weaker than expected. Continued increases in real wages provide some cause for optimism.
The Bank of Japan raised interest rates to 1.25% on 18 September. Inflation remains above Japan’s 2% target rate, at 2.5%. Some economic commentators assess that the Bank of Japan may increase the speed of future rate rises, from approximately every six months to quarterly. Further interest rate increases should help address the weak yen.
For the year ending June 2026 New Zealand total exports to Japan grew by 6.4% to NZD 4.85bn. The value of aluminium and meat exports increased significantly due to rising commodity prices. Most other exports saw limited increases or declines. Imports from Japan increased by 20.4% to NZD 5.12bn, largely due to the increase in mineral fuel (mainly diesel) imports.
Report
Economic outlook
The Cabinet Office projects real GDP growth for the 2026 financial year (April 2026 to March 2027) to be 0.9%. This would represent a slight increase over 0.8% growth in the 2025 financial year. Growth projections were revised downward, compared to earlier projections made in January 2026, with real GDP growth for the 2026 financial year then projected at 1.3%.
Real GDP growth for the second quarter (April – June) was below expectations at 0.3%, compared to the previous quarter. Private consumption had been weaker than expected and corporate investment was also down. Real wages rose by 2.4% in July, compared to a year earlier. This was the biggest real wage increase recorded since May 2021 and marks seven consecutive months of real wage increases.
The Cabinet Office’s Economic Watchers Survey highlighted the economic challenges posed by the impacts of the Middle East conflict and the Kumamoto Earthquake in July 2026.
Preliminary data from the Cabinet Office for July 2026 showed that the current cycle of economic expansion is highly likely to have become the longest period of economic expansion since the end of World War II. This is subject to formal determination by the Cabinet Office business-cycle panel. The previous longest period was from February 2002 to February 2008, known as the Izanami boom. The current period of economic expansion began as the economy recovered from COVID-19 pandemic lows in May 2020. From October 2020 to June 2026 annualized quarter-on-quarter real growth was 1.3% (the July-September 2020 quarter being excluded when the real GDP growth rebounded sharply over COVID-19 lows). This was slightly behind the 1.6% average during the Izanami boom.
Strengthening the yen?
The yen remains historically weak against the US dollar, but it has recently recovered somewhat. After falling to around JPY 164/USD in late July, the currency strengthened to the JPY 154-155/USD range by mid-September, an appreciation of roughly 6%.
On 18 September the Bank of Japan raised interest rates to 1.25%, a rate increase of 0.25%. This is the highest level since 1995. The Bank of Japan indicated it would be monitoring inflation closely. The Bank of Japan forecasts the Consumer Price Index (excluding fresh food and energy) to be at 2.5% in the 2026 financial year and decrease to 2.2% during the 2028 financial year, closer to its 2% inflation target. Fuel and energy subsidies have insulated Japan somewhat from inflationary pressures caused by conflict in the Middle East.
Some economic commentators have assessed that the risk of rising inflation may lead the Bank of Japan to raise interest rates on a quarterly basis, rather than every six months, going forward. Accelerating interest rate increases would help to strengthen the yen but also increase government borrowing costs. The government’s plan to temporarily lower consumption tax on food items from April 2027 may help dampen inflationary pressures.
International Trade Snapshot
Japan’s exports increased by 19.3% for the month of August 2026, compared to the same month the previous year. This marked 12 consecutive months of export increases. However, imports rose more quickly, seeing a 28.0% increase. This led Japan to record a trade deficit of JPY 1.1tril (NZD 12.3bn) for the month of August, the fourth straight month of trade deficit. Increasing oil prices due to the crisis in the Middle East are seen as a major contributing factor for Japan’s trade deficit.
The weak yen continues to support strong export growth. The Bank of Japan released figures showing export prices in JPY rose by 17.9% for the year ending August 2026. Rising semiconductor prices, as well as other electronic components, supported strong export growth. But the weak yen has also made imports more expensive, with import prices rising 24.8% over the same period.
Trade with New Zealand
For the year ending June 2026 two-way trade was NZD 9.96bn with exports at NZD 4.85bn and imports at NZD 5.12bn. This represents a 6.4% increase in exports and a 20.4% increase in imports compared to a year ago. During this period Japan was New Zealand’s sixth-largest trading partner and fourth-largest export market.
New Zealand Goods Trade with Japan (NZD year to June 2026)
| Total Goods Trade | $8.8bn | ||
|---|---|---|---|
| NZ exports | $4.1bn | NZ imports | $4.69bn |
| Main exports | Dairy Products; Fruits and Nuts; Aluminium; Meat and Edible Offal; Wood | Main imports | Vehicles; Mineral Fuels and Oils; Mechanical Machinery; Electrical Machinery |
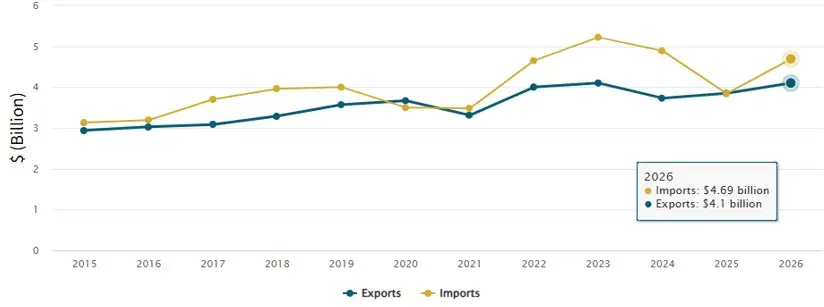
More recent goods exports data for the year ending July 2026 showed that many of our key export commodities saw limited growth or declines. The exceptions were aluminium and meat which both saw strong growth in value terms.
The increase in the value of aluminium exports can be attributed to elevated global aluminium prices, largely due to the conflict in the Middle East. Pre-conflict Japan imported significant volumes of aluminium from the Middle East. While aluminium exports in value terms grew by 28.2%, in volume terms they only grew by 2.2%.
Elevated meat (mainly beef) prices also contributed to the increase in exports on a value basis by 15.9%, while volume declined by -1.4%.
New Zealand Goods Exports to Japan by Industry
Year Ending July 2026
| Industry | Year Ending July 2026 | ||
|---|---|---|---|
| $ Millions | % Change | % Share | |
| Dairy Products | 1,018 | -2.4 | 25.3 |
| Fruit and nuts | 821 | 0.8 | 20.4 |
| Aluminium | 642 | 28.2 | 16.0 |
| Meat and Edible Offal | 490 | 15.9 | 12.2 |
| Wood | 291 | -7.5 | 7.2 |
| Miscellaneous food | 238 | -5.7 | 5.9 |
| Fish | 62 | -13.7 | 1.5 |
| Subtotal of leading Industries | 3,562 | N/A | 88.6 |
| Other goods | 403 | N/A | 11.4 |
| Total | 4,049 | 4.26 | 100 |
The impact of the crisis in the Middle East can be seen in our imports from Japan. Much of the increase in imports from Japan was due to the significant rise in imports of mineral fuels (largely diesel), which increased by 227% in value terms to NZD 730m. In volume terms imports of mineral fuels rose 145% to 550 million litres. But this was still below the 634 million litres imported from Japan in the year ending July 2024.
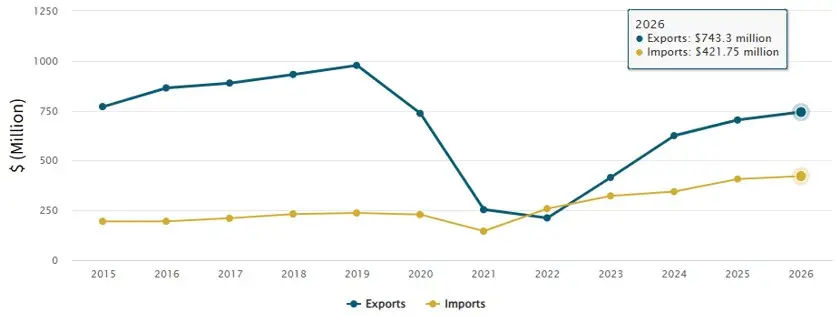
Services trade saw slight growth, with both exports and imports seeing moderate increases. Visitor numbers continued to increase, with 78,249 arrivals from Japan in the year ending June 2026, up from 72,334 for the year ending June 2025.
New Zealand Services Trade with Japan (NZD year to June 2026)
| Total Services Trade | $1.17bn | ||
|---|---|---|---|
| NZ exports | $743.3m | NZ imports | $421.75m |
| Main exports | Travel; Business Services; Government Services; Financial Services | Main imports | Travel; Business Services; Charges for Intellectual Property; Government Services |
More reports
View full list of market reports
If you would like to request a topic for reporting please email exports@mfat.govt.nz
Sign up for email alerts
If you would like to subscribe to this weekly update, go to our subscription page(external link) or email us at exports@mfat.govt.nz
Feedback
We welcome feedback from New Zealand exporters on this report and invite requests for reporting from New Zealand’s network of Embassies and High Commissions. If you have suggestions on a topic you would like to hear more about, or to subscribe to this weekly update, you can sign up here(external link) or email us at exports@mfat.govt.nz
External links
The following links may provide useful information to businesses:
NZTE’s website(external link) and their myNZTE(external link) provides a range of insights and tools available to support New Zealand exporters.
The Treasury releases a weekly economic update(external link) every Friday. Stats NZ has published a data portal(external link) with near real-time economic indicators.
MBIE publishes a sector reports series(external link) which provides regularly updated reports on all industry sectors that make up the New Zealand economy. These include official economic data and the challenges and opportunities that face New Zealand’s industry sectors.
Business.govt.nz(external link) provides tools and advice from across government to save small businesses’ time and help make the business a success.
MFAT has created a tariff finder(external link) which is designed to help goods exporters and importers maximise benefits from New Zealand’s Free Trade Agreements and compare tariffs in 136 other markets.
The all of government Trade Barriers(external link) website can be used to register any trade barriers experienced or issues exporting to an offshore market. Queries can be sent via the website or through the MFAT Exporter Helpline 0800 824 605. Enquiries will be sent to the government agency best placed to answer.
Tatauranga Aotearoa Stats NZ provides official data on the value of New Zealand’s exports and imports of both goods and services, by commodity type via the New Zealand Trade Dashboard(external link). This interactive dashboard is updated every quarter and allows for filtering by country and by commodity type.
Learn more about exporting
New Zealand Trade & Enterprise’s comprehensive market guides(external link) cover export regulations, business culture, market-entry strategies and more.
Disclaimer
This information released in this report aligns with the provisions of the Official Information Act 1982. The opinions and analysis expressed in this report are the author’s own and do not necessarily reflect the views or official policy position of the New Zealand Government. The Ministry of Foreign Affairs and Trade and the New Zealand Government take no responsibility for the accuracy of this report.
Copyright
Crown copyright ©. Website copyright statement is licensed under the Creative Commons Attribution 4.0 International licence(external link). In essence, you are free to copy, distribute and adapt the work, as long as you attribute the work to the Crown and abide by the other licence terms.