Supply Chains, Primary Products, Manufacturing (excludes F&B):
On this page
Key points
- The rapid escalation of global trade tensions in recent months has generated a highly uncertain trading environment, which is expected to weigh on global growth.
- Tariff hikes have started to impact some international merchandise trade flows, with Chinese exports to the United States in April around 20% lower compared to the same month a year ago. The fall in exports to the US looks to have been diverted to markets in Asia and Europe.
- Disruptions to trade look to have fed through to global manufacturing activity. Surveys of Chinese manufacturers suggest new orders for exports fell heavily in April.
- The temporary respite in trade tensions between the United States and China has been followed by a rise in shipping costs on some trans-Pacific routes. Importers in the United States may be bringing orders forward while tariffs are lowered.
- To date, there has been little evidence of trade disruptions for New Zealand. Export commodity prices remain elevated, and the value of merchandise exports was 25% higher in April compared to last year.
- Nevertheless, the rapid change in trade policy is likely to provide ongoing challenges for New Zealand exporters.
The rapid escalation of trade tensions will shape global trade over 2025…
Dominating trade developments in 2025 has been the rapid escalation of global trade tensions. The additional import tariffs imposed by the United States, and retaliation by China, are significant and have occurred at such a pace that we are starting to see the impact in global economic data.
Tariffs imposed on China by the US and vice versa reached peaks of 145% and 125% respectively on most goods in mid-April. Since the initial announcement on 2 April, we have seen some temporary relaxation of reciprocal tariffs by the US on most countries down to 10% – on top of existing tariffs. And on May 12, trade tensions eased following trade talks between the US and China, with the temporary 115 percentage point reduction in import tariffs by both parties. Nevertheless, elevated tariffs remain, such as the 30% tariff on most US imports from China. Adding to fast-moving trade developments, the US reciprocal tariff policy is now being challenged in the US Federal court system.
…adding uncertainty and volatility to the global economy.
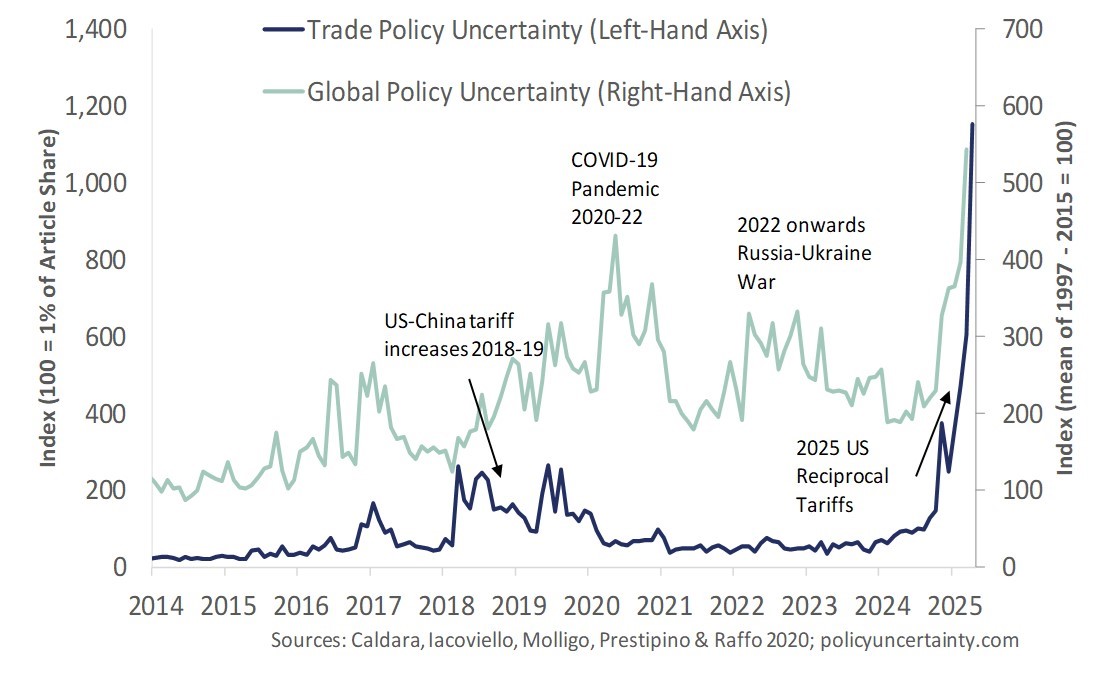
The rapid change in global trade policy in recent months has created a highly uncertain international trading environment, which is expected to weigh on global economic growth. Financial markets have endured wild swings in currencies and stock prices since early April. Measures of economic policy uncertainty have surged on the back of trade policy uncertainty (Figure 1). And forecasts of global growth, such as those published by the IMF, have been revised lower because of tariff escalation.
Figure 1: Economic Policy Uncertainty Index
Recent data is starting to reveal the initial shock and uncertainty of tariffs on global trade
There appears to have been a jump in imports into the US over the first quarter of 2025, as importers stockpiled ahead of expected tariff increases. Official trade data showed that the value of imports of goods in the March quarter were 25% higher than the same period last year.
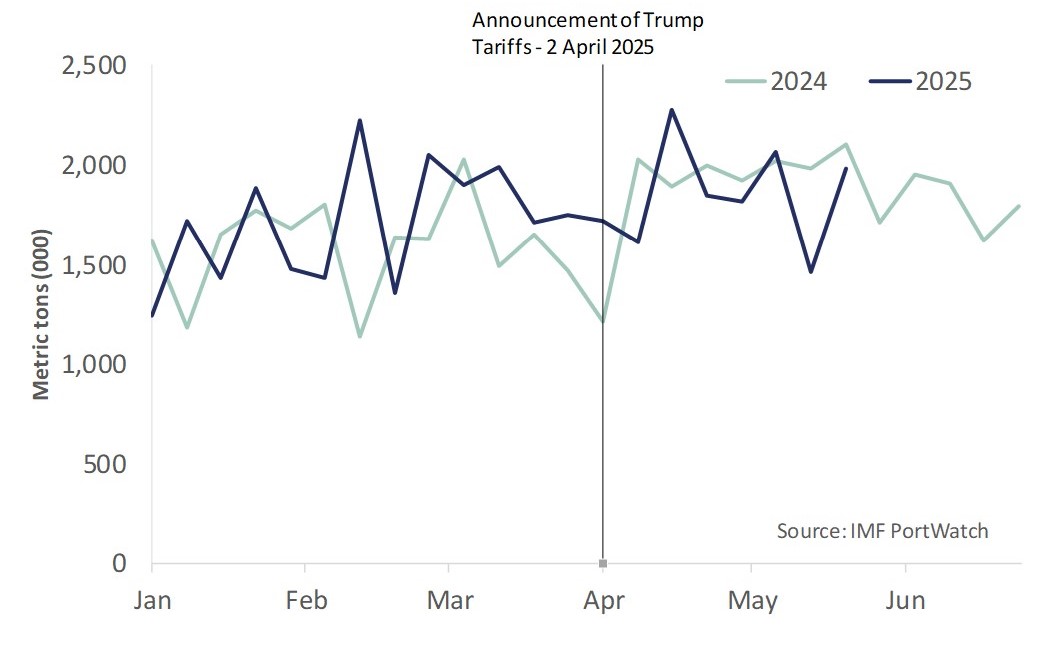
In addition, data from the IMF’s Portwatch provides some early indications of trans-Pacific shipments to the United States. The Ports of Los Angeles and Long Beach were estimated to have handled almost 22% more imports by volume in the March quarter compared to the same period in 2023 and 2024 (see Figure 2a below). The Port of New York and New Jersey had an 11% increase in throughput in the March quarter compared to the last few years (see Figure 2b below).
To date there has only been limited trade and economic data released following recent tariff changes. However, data is starting to reveal the initial impact of rising tariffs on trade and activity. According to China Customs, the value of exports to the US in April was down 21% on a year earlier. The largest contractions were recorded for electrical goods, mechanical machinery, and many consumer goods categories such as furniture, toys and games, and clothing. Overall, China’s exports increased 5.6% year on year in April, with the fall in exports to the United States being offset by a jump in shipments to ASEAN economies (up 20.8% year on year) and the European Union (up 8.3% year on year). Heading the other way, imports into China from the United States fell 14% over the same period, with large falls seen in agricultural products such as cereals.
We have yet to see the same sort of movements in US data since March, in part because of the lags involved in shipping and logistics. For instance, while US tariffs were imposed on imports from China in early to mid-April, it takes weeks for shipments of goods to transit between Asia and the United States.
However, there are signs that the import volumes being processed by major US ports are easing. In the four weeks to May 23rd, Portwatch estimates that the ports of Los Angeles and Long Beach have processed around 5% less imported volumes compared to a similar period over the last few years, with a sharp fall estimated in the week of May 23rd (Figure 2a). Import volumes at the Port of New York and New Jersey look to have held up since March (Figure 2b), which may be due to the different mix of imports by source country and the longer lags involved with trade from Asia to the US east coast.
Figure 2a: Estimates of import volumes to the Ports of Los Angeles and Long Beach
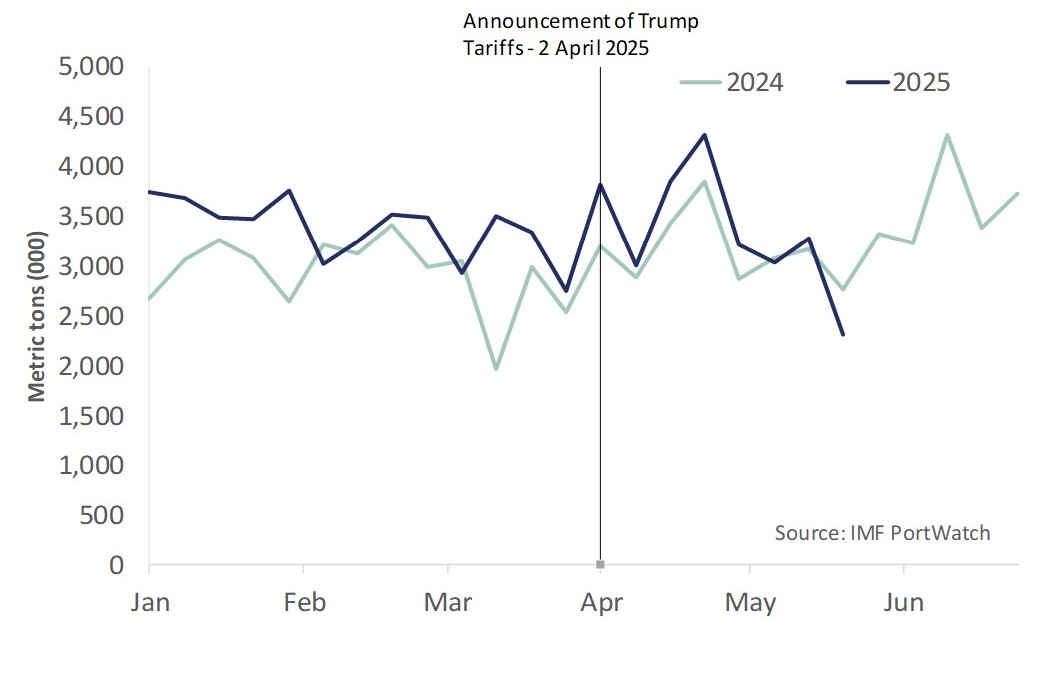
Figure 2b: Estimates of import volumes to the Port of New York and New Jersey
The disruption to trade looks to have flowed through to global manufacturing.
In an early sign that tariff hikes are feeding through to global manufacturing, forward indicators of global manufacturing activity softened in April. The Institute for Supply Management (ISM) manufacturing index (an indicator of US manufacturing activity) eased 0.3 points to 48.7 in April, down from a recent high of 50.9 in January. A reading of above 50 suggests that manufacturing activity is expanding while a reading of below 50 suggests activity is contracting. However, China’s equivalent, the official Purchasing Managers index (PMI), experienced a larger hit in April, falling 1.5 points to 49, to reach its lowest reading since late 2023.
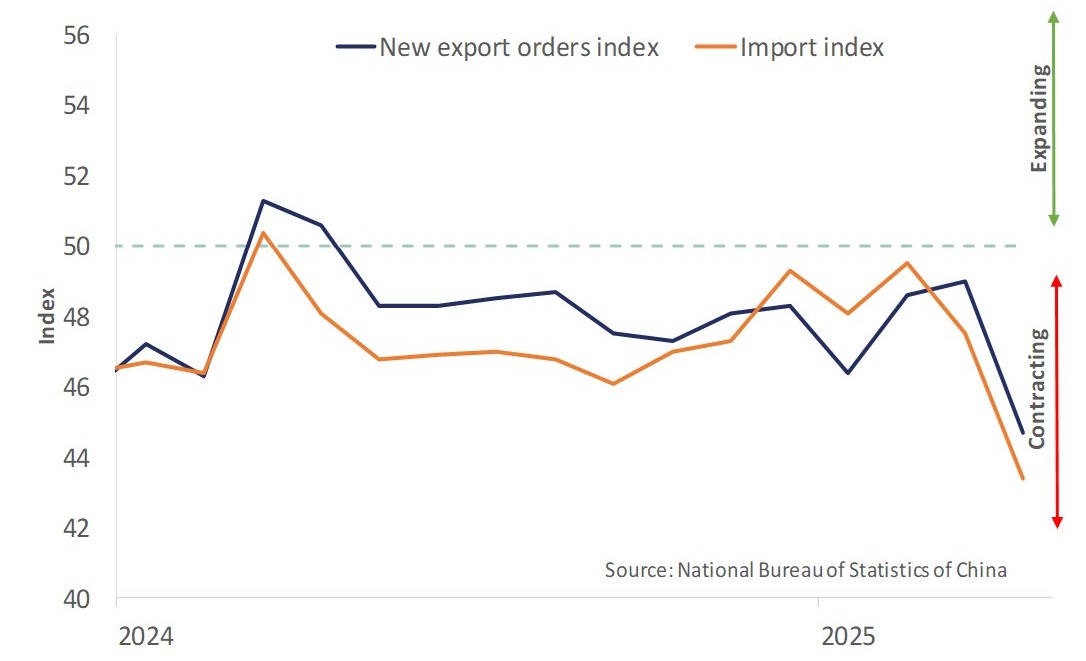
The underlying measures of China’s PMI relating to trade, such as new export orders placed with, and imports made by, Chinese manufacturers also fell sharply in April (Figure 3). The new export orders index fell 4.3 points to 44.7, while the imports index fell 3.1 points to 44.8.
Figure 3: China’s official Purchasing Managers’ Index
Shipping costs have eased in 2025, but costs on China-US routes are changing course.
In 2024 global maritime trade faced disruption and higher shipping costs between Asia and Europe following attacks by Houthi Rebels on commercial shipping in the Red Sea. However, maritime trade routes adjusted, with commercial shipping avoiding the Red Sea and instead sailing around the Cape of Good Hope. As global shipping and logistics adjusted to a new reality, global shipping costs began to trend lower from the second half of 2024 and into 2025 (Figure 4).
Global shipping costs fell further at the start of April after the US announcement of reciprocal tariffs, with shipping rates between China and the US recording sharp falls in April. However, in what seems symptomatic of the current volatile global economic environment, there are now signs of a near-term rise in trans-Pacific trade.
For instance, following the agreement reached on May 12 between the US and China to reduce tariffs, shipping costs between China and the US have started to rise (Figure 4). Given the potential temporary nature of the reduced tariffs between the US and China, US importers are likely to bring forward orders of goods for the holiday season later in the year. This has resulted in reduced shipping capacity on routes between the US and China as trade catches up from earlier disruption caused by tariff escalation.
Figure 4: Drewry World Container Index

So far there are few signs of disruption to New Zealand’s trade
Here in New Zealand, US tariffs have imposed a direct cost on most, if not all, firms exporting goods to the US. Some smaller niche exporters have also been hit hard by the expansion of coverage of the 25% additional tariffs on steel and aluminium to cover a wider range of derivative products. In addition, firms exporting goods to the US may face higher indirect costs from the more complex and time-consuming clearance procedures, as US customs grapples with multiple and frequently changing tariffs. However, for now there are few signs of disruption to New Zealand’s trade.
Commodity prices for our largest export categories have held up and remain at favourable levels for exporters. For instance, ANZ bank’s commodity price index held steady in April as dairy and meat prices helped to offset falls recorded in forestry and aluminium prices (Figure 5). In May, prices look to have continued to hold, with some strong gains recorded on the Global Dairy Trade (GDT) auction at the start of the month. The headline GDT price index for May was around 11% up on the start of the year.
Figure 5: ANZ Commodity Price Index (World Prices)
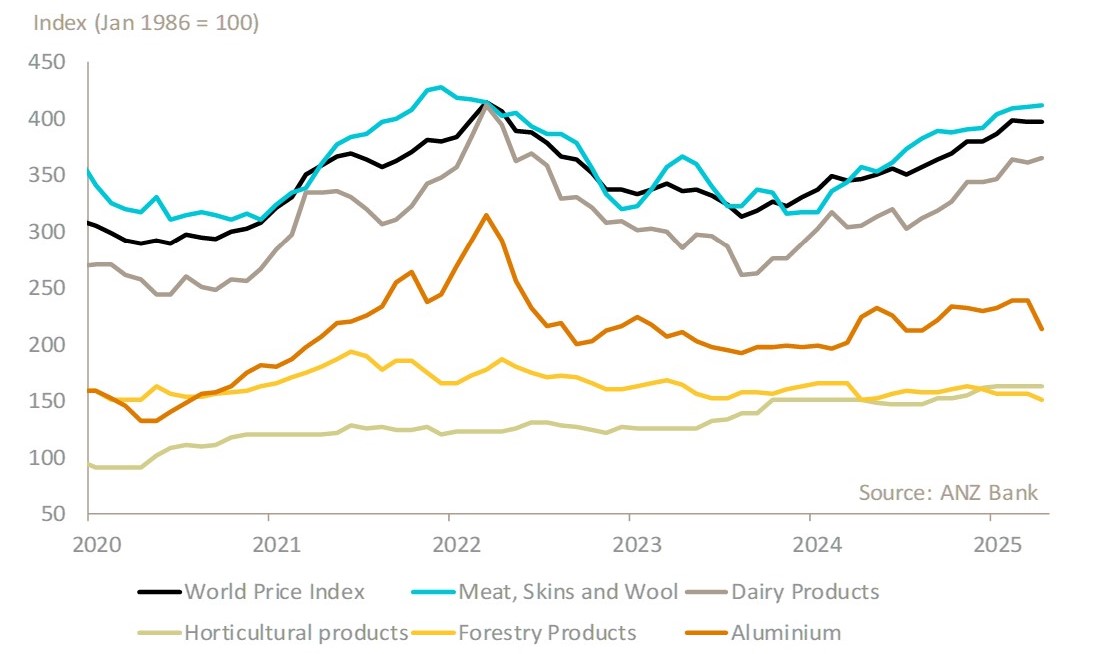
These elevated prices will continue to support New Zealand export returns for now. Merchandise trade data released by Statistics New Zealand for April recorded a solid month for exports. The value of exports for the month was 25% higher than last April, thanks to strong gains seen in dairy, meat, and kiwifruit exports. However, it’s too early to see any impacts of changes to global trade policy in New Zealand’s trade data.
…although uncertainty in global trade policy could still negatively impact New Zealand’s export performance over the rest of 2025.
The decision by the United States and China to scale back the level of increase in their tariffs for a 90-day period is welcome. However, it is unlikely the global trading system will go back to how settings were prior to April anytime soon. For New Zealand exporters there are likely to be some bumpy times ahead as trade policy changes continue to evolve over 2025, adding to the elevated level of trade policy uncertainty.
More reports
View full list of market reports(external link)
If you would like to request a topic for reporting please email exports@mfat.govt.nz
Sign up for email alerts
To get email alerts when new reports are published, go to our subscription page(external link)
Learn more about exporting to this market
New Zealand Trade & Enterprise’s comprehensive market guides(external link) export regulations, business culture, market-entry strategies and more.
Disclaimer
This information released in this report aligns with the provisions of the Official Information Act 1982. The opinions and analysis expressed in this report are the author’s own and do not necessarily reflect the views or official policy position of the New Zealand Government. The Ministry of Foreign Affairs and Trade and the New Zealand Government take no responsibility for the accuracy of this report.
Copyright
Crown copyright ©. Website copyright statement is licensed under the Creative Commons Attribution 4.0 International licence(external link). In essence, you are free to copy, distribute and adapt the work, as long as you attribute the work to the Crown and abide by the other licence terms.