Primary Products, Manufacturing (excludes F&B), Government:
On this page
Summary
From 5 April 2025, the United States announced a 10% base tariff on imports of goods from many countries, including New Zealand. From 7 August, along with various tariff rate changes for many other countries, our rate was raised further to 15%.
The recent release of July 2025 trade statistics means that there is now nearly four months of export data following the 10% tariff announcement for examining the tariff’s impact on our United States exports.
Overall, the first complete post-tariff July quarter 2025 saw an annual fall of -3.0% in exports to the United States. The United States accounted for 13% of our exports in the July quarter 2024. In comparison, our non-United States exports – 87% of our export market – in the same period were up +10.8%.
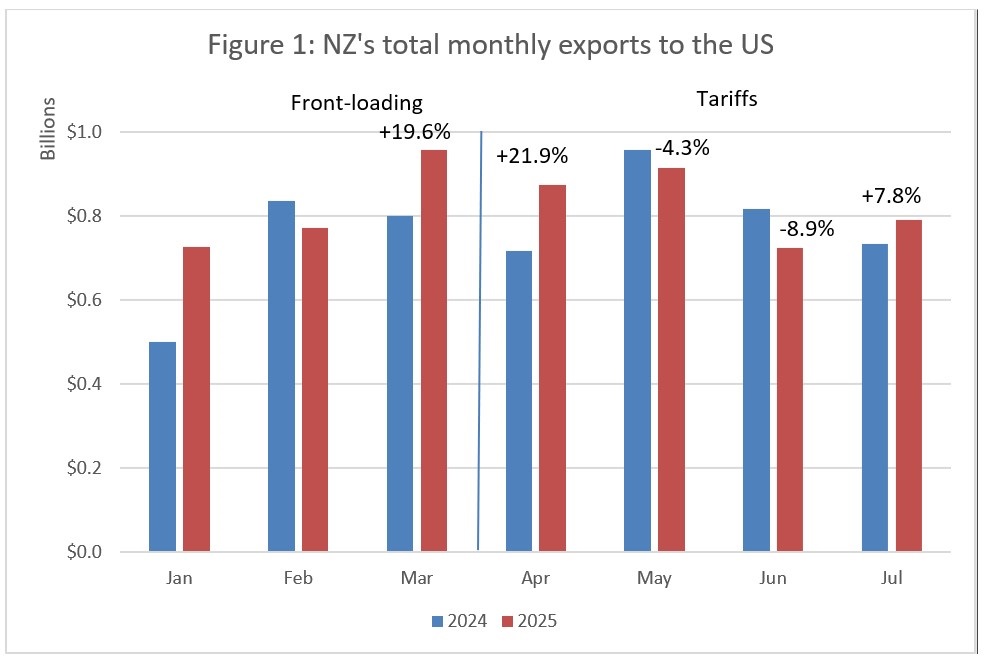
Exports to the United States grew very strongly in the immediate pre-tariff month and the tariff month – up +19.6% annually in the March month 2025 and +21.9% in April 2025. The next two months saw annual monthly contractions, exports falling -4.3% in May and -8.9 in June. However, July 2025 has seen an encouraging though incomplete bounce-back. Annual monthly exports were up +7.8%.
Some post-tariff effects are due to permanent reduced spending on New Zealand’s now higher priced exports into the United States. However, United States importers also built up their stocks by front-loading exports into the pre-tariff period. In the immediate post-tariff period, this caused a temporary decline in our exports, to be followed by an eventual bounce-back as restocking becomes necessary. At this stage, we cannot establish the exact mix of permanent and temporary effects underpinning this weak -3.0% United States figure.
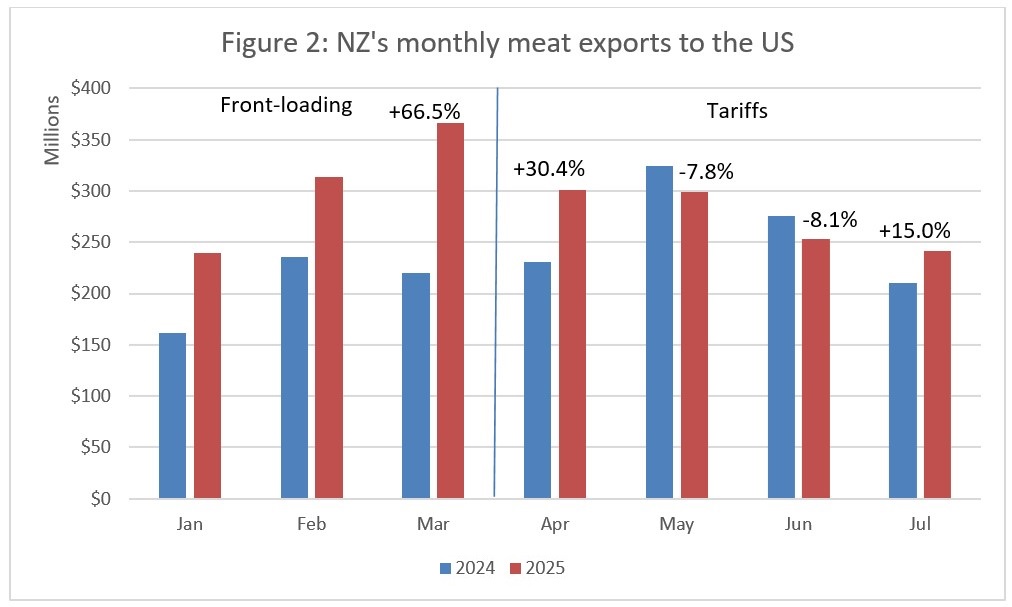
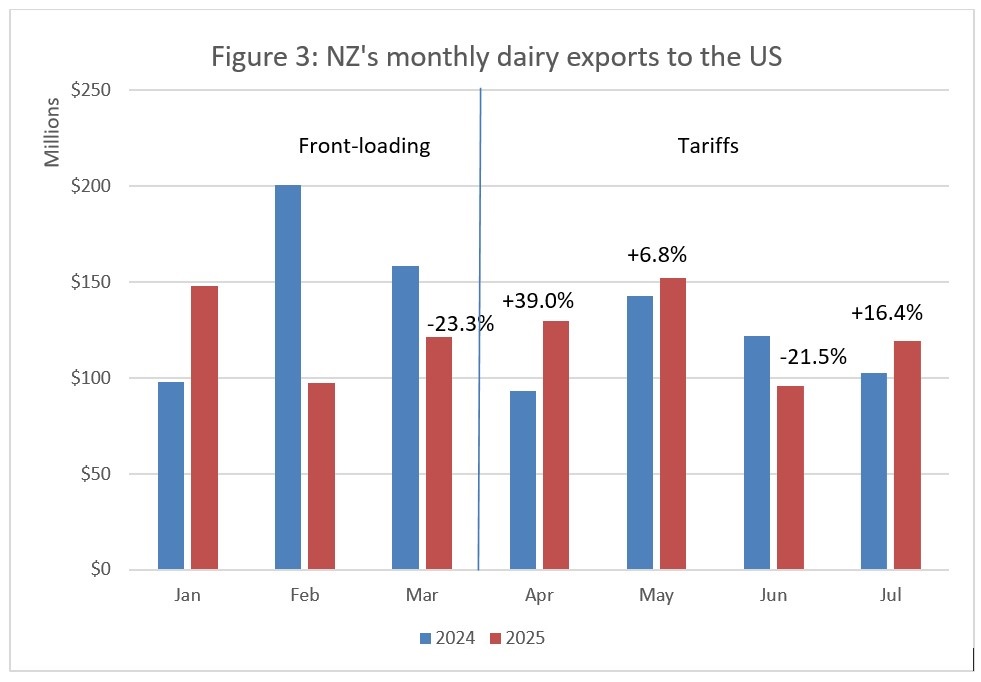
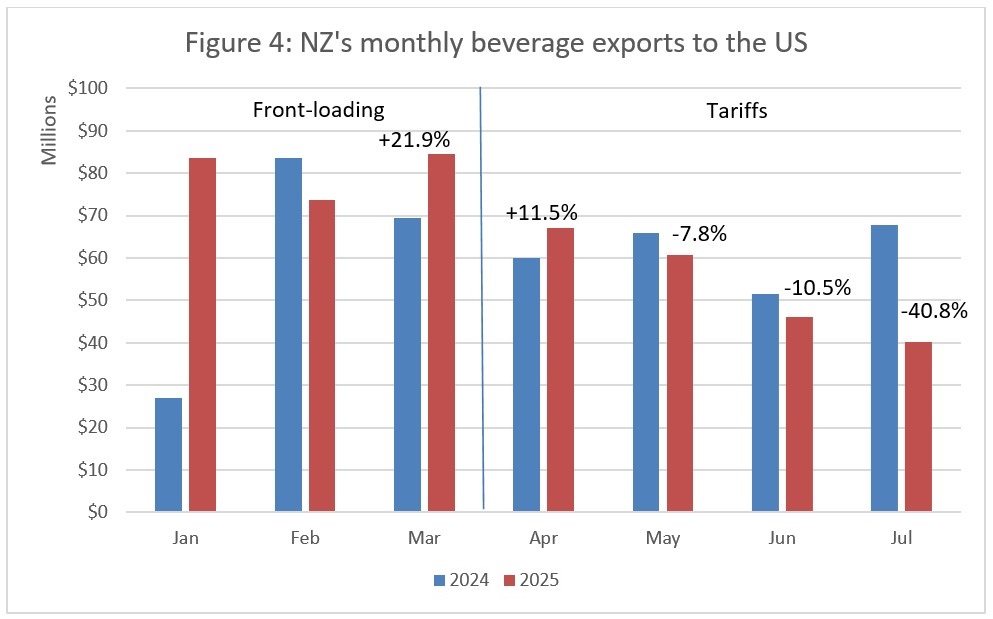
In terms of specific commodities accounting for significant proportions of our United States exports, the strongest evidence for limited permanent effects in the post tariff July quarter is for dairy (annually up an imperceptible +0.1%) and meat (down a modest -2.0%). Wine, however, was especially weak, down a substantial -21.9%.
Both temporary and permanent effects in the United States are greatly diminished in their importance if our other export markets, making up 87% of our trade, are rapidly growing. The +10.8% July 2025 quarter annual growth in non-United States markets indicates rapid growth, more than cushioning any tariff impact.
Report
The recent release of July 2025 trade statistics means that there is now nearly four months of export data following the 10% tariff announcement to examine for emerging impacts on New Zealand exporters (much of April, and all of May, June and July). Reporting on the impact of the further raise to 15% will follow at the end of the next quarter.
Monthly exports to the United States were especially strong in the tariff lead-up months of March and April 2025. Annual month-on-month growth was +19.6% in March and +21.9% in April. At least some of the strong March and April data represents front-loading by United States importers of their stocks in anticipation of tariffs. The first five days of April were tariff-free, so exports could also be front-loaded there. Exports subsequently fell in May (-4.3%) and June 2025 (-8.9). These falls reflect a mix - temporary effects of the front-loading and stock build-up of March and early April, and permanent reduced spending on New Zealand’s now higher priced exports in the United States.
Bounce-back from the front-loading is also emerging. Exports in the June 2025 month were well up – +7.8% – on monthly values of the previous year. Overall, however, annual exports in the first complete post-tariff quarter of July 2025 quarter were down by -3.0%. In comparison, our total world-wide exports in the same period were up +9.0%.
Meat exports - primarily of beef - were 29.1% of our total exports to the United States in 2024. Meat exports were very strong through the first quarter of the 2025 year, especially in the last full pre-tariff month of March, when they grew annually by a spectacular 66.5%. Meat exports maintained considerable strength into April, a partial tariff month, growing by +30.4%. The strength across these two months represents pre-tariff front-loading. The two entirely post-tariff months of May and June were both somewhat weaker than 2024, falling by -7.8% and -8.1% respectively. There was a considerable bounce-back in July, with growth of +15.0%. Overall, annual meat exports in the full-tariff July quarter were down only -2.0% on the previous year.
Dairy exports accounted for about 16.0% of our United States exports in 2024. Monthly dairy exports to the United States were volatile. There is no evidence of a front-loading pattern in March 2025, with annual monthly exports falling by -23.3%. There is some evidence of front-loading in the partial tariff month of April, with annual growth of +39.0%. May was a moderately better month than in the previous year, rising +6.8%. On the contrary, June data suggest some developing weaknesses, falling a considerable -21.5%. But with growth of +16.4% there has been a solid bounce-back again in July. Overall, the volatility cancelled out and annual exports in the full-tariff July quarter were very marginally up (+0.1%) on the previous year.
Wine exports to the United States, basically all beverages exported, were 8.3% of our exports to the United States in 2024. These rose annually in the March month of 2025 by +21.9% and in April by +11.5%. This strong growth shows pre-tariff front-loading by United States importers (it is not clear why the January 2025 month was so strong compared to the same month in 2024 and the February month so weak, but it looks like there was some shift overall in January/February yearly pattern). Considerable weaknesses have emerged in the May and June months, with declines of -7.8% and -10.5% respectively. These May and June declines may just reflect the earlier front-loading of March and April. But July has been especially weak, falling by a substantial -40.8%. There is no evidence of any post-tariff bounce-back. Overall, annual exports in the full-tariff July 2025 quarter were well down, falling by -20.6% compared to the previous year. Hence, wine is one area where we see stronger evidence of permanent moves away from the more highly priced post-tariff New Zealand exports.
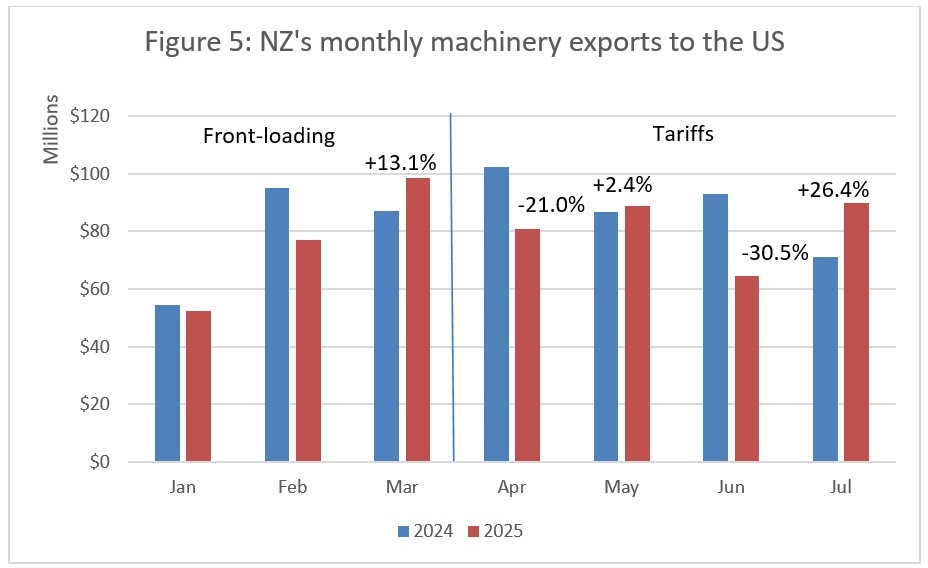
The above New Zealand commodities are consumption goods exports to the United States. Exports of machinery to the United States are primarily longer lasting investment goods and amounted to 12.6% of our United States exports in 2024. Investment goods are a category where we expected more front-loading than relatively perishable food and drink consumption goods, particularly since most of these had previously not faced much of a tariff. But no such pattern is evident in the data. Monthly machinery exports in 2025 were volatile in comparison to their 2024 values. If there was front-loading, it only occurred, and modestly at that, in the March 2025 month, where annual monthly exports grew by +13.1%. However, April 2025 was very weak, annual monthly exports falling -21.0%. Having held up valiantly in May 2025, annual monthly growth being +2.4%, machinery exports were notably soft again in June 2025 (-30.5%). The July month, by contrast, was remarkably and surprisingly strong at annual monthly growth of +26.4%. These complex monthly patterns defy easy interpretation, which is not surprising. These investment goods are, by their nature, far more volatile than consumption goods. Overall, annual growth in the complete post-tariff July quarter was -3.0%. The weak quarterly performance could be tariff-related, or it could also be driven by falling investment demand revealed in the United States second quarter GDP data.
Comment
Consideration of New Zealand exports to the United States in the part (April) and full post-tariff months of 2025 (May, June, July) following the imposition of the 10% tariff suggests that some weakening emerged in May and June, with a partial bounce-back in July.
Some of this weakening is due to reductions in United States’ demand for New Zealand’s exports as tariffs have increased our export prices in the United States. This demand reduction is a long-term impact. Some of this effect is temporary, due to front-loading, which will eventually be followed by a bounce-back. The permanent demand effect is clearly more concerning for New Zealand than the temporary front-loading effect. We believe that both phenomena are present in the data. However, we cannot establish the relative mix of permanent and temporary effects in the -3.0% annual growth in United States exports in the July 2025 quarter.
While it is likely to impact on specific firms, at a macro level both temporary and permanent squeezes in the United States market are less impactful if our other export markets are rapidly growing. New Zealand’s overall non-United States annual export growth in the July quarter 2025 has been extremely strong at 10.8%. Growth is evident in nearly all our other significant trading relationships. Annual trade with China in the July quarter 2025 was up +9.7%. With Australia, it rose by +8.7%. The European Union increased by +33.6% and with South Korea it jumped by +21.9%. The United Kingdom grew by 13.6%. The only other exporting weakness amongst major trading partners in this period was with Japan, where exports fell by -3.4%.
We also examined smaller export categories to the United States to detect an effect, but the disaggregated data were too volatile to draw conclusions.
More reports
View full list of market reports
If you would like to request a topic for reporting please email exports@mfat.net
Sign up for email alerts
To get email alerts when new reports are published, go to our subscription page(external link)
Learn more about exporting to this market
New Zealand Trade & Enterprise’s comprehensive market guides(external link) export regulations, business culture, market-entry strategies and more.
Disclaimer
This information released in this report aligns with the provisions of the Official Information Act 1982. The opinions and analysis expressed in this report are the author’s own and do not necessarily reflect the views or official policy position of the New Zealand Government. The Ministry of Foreign Affairs and Trade and the New Zealand Government take no responsibility for the accuracy of this report.
Copyright
Crown copyright ©. Website copyright statement is licensed under the Creative Commons Attribution 4.0 International licence(external link). In essence, you are free to copy, distribute and adapt the work, as long as you attribute the work to the Crown and abide by the other licence terms.